Understanding and Using Earnings Per Share (EPS) for Investing

-
Earnings per share (EPS) is a fundamental financial indicator that measures a company's Net Income divided by the Number of Shares Outstanding. It is used to assess profitability per share.
-
EPS allows for the comparison of companies of different sizes within the same industry and helps assess growth.
-
It is directly related to valuation ratios such as Price/Earnings (P/E).
-
Use EPS to assess the effectiveness of management in generating profits, the sustainability of potential dividends, and the valuation of a stock relative to its earnings power.
Concretely, if a company makes a profit of one million dollars and has one million shares outstanding, each share "owns" $1 of that profit. There you have it, that simple calculation we see everywhere in financial news.
To understand why EPS has become such an important indicator, we need to bring it back to THE question every investor faces: What is a company's real value?
The Attractive Side of EPS in Analysis🔗
The popularity of EPS as an investment metric is based on several appealing theories. First, it offers a standard way to compare the profitability of companies of different sizes. A small company with a profit of $10 million may seem less impressive than a large company with a profit of $100 million. But if it has fewer shares outstanding, its EPS could actually be higher, so it could have a better return per share.
| Company A | Company B | |
|---|---|---|
| Earnings | $10M | $100M |
| Shares Outstanding | 5M | 70M |
| EPS | $2 | $1.43 |
This standardization is very useful for tracking a company's performance over time. As companies grow or shrink, issue new shares, or repurchase existing shares, absolute earnings become difficult to interpret. EPS adjusts for these changes in capital structure, providing a better picture of profitability from a shareholder's perspective.
EPS also forms the basis for other important investment metrics. The price-to-earnings ratio (PER), probably the most widely used valuation metric, simply divides the share price by the EPS. Without EPS, it would be difficult to know if a stock is reasonably priced relative to its profitability.
The advantages of EPS as an investment criterion🔗
-
EPS data is available for almost all listed companies. Financial websites, newspapers, and investment platforms all provide EPS figures.
-
This metric is a good indicator of management effectiveness. A growth in EPS over the years can indicate that the company's management is successfully expanding its business, controlling costs, or both. This growth trend can mean that the company is healthy and well-managed, and represents a good investment opportunity. Conversely, a decline in EPS can be a warning sign before problems become truly serious and threaten the company's survival.
-
Basic EPS uses the current number of shares, while diluted EPS takes into account shares from stock options, convertible bonds, and other instruments. This difference allows investors to understand both the current situation and potential future dilution.
Limitations of EPS🔗
Perhaps the biggest problem is that EPS is an accounting measure rather than a cash flow measure. Earnings can be manipulated by accounting choices, such as depreciation methods, inventory valuation, or the timing of revenue recognition.
Two companies with identical cash flows can post very different EPS simply because of different accounting policies.
Earnings quality is another issue. A company can post high EPS by cutting crucial investments in research and development, maintenance, or employee training. While these reductions are good for short-term profits, they are less so for long-term competitiveness. Additionally, a company can increase its EPS through financial means, such as borrowing to buy back shares, which reduces the share count and artificially inflates per-share metrics without improving the business.
Timing issues further complicate EPS analysis. Earnings can be extremely volatile, for example, for cyclical companies or those exposed to commodity prices. A single quarter, good or bad, can distort annual EPS, making it difficult to assess a company's ability to generate profits. This volatility becomes a real problem when investors overreact to short-term changes in EPS without considering the broader environment.
The Importance of the Sector and the Business Model🔗
For mature, stable companies with predictable industries, such as utilities or consumer staples, EPS often provides reliable information on the company's performance and valuation. Typically, these companies generate consistent profits that translate into cash flow, making EPS a good indicator of shareholder value creation.
But for growing companies, particularly in the technology or biotechnology sectors, EPS can be much less meaningful, and even misleading! These companies may be making losses while investing heavily in expansion: a negative EPS is then a sign of aggressive growth investments, rather than a business failure.
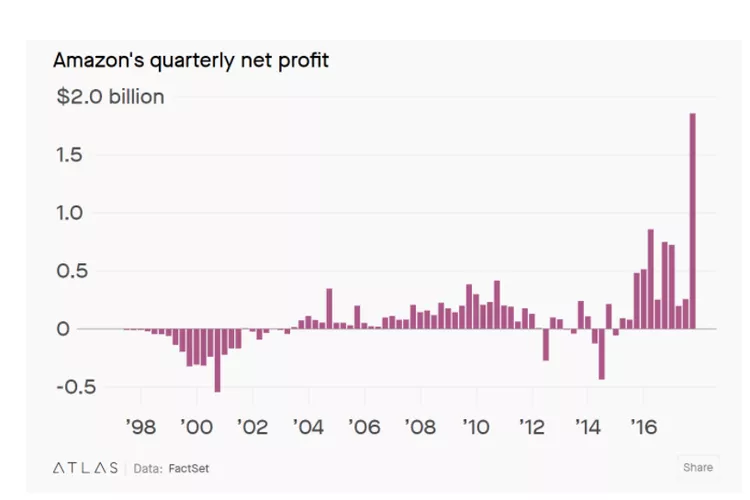
Amazon is known for posting minimal or even negative profits for years while consolidating its dominant market position. Investors overly focused on EPS missed one of the greatest investment opportunities of our time.
Capital-intensive sectors are also somewhat complicated when analyzing EPS. Manufacturing, real estate, and transportation require significant ongoing capital investments to maintain their competitive position. EPS does not directly account for these capital requirements, so the profits available to shareholders may be lower than they appear at first glance. This is why professional investors prefer cash flow metrics to evaluate capital-intensive companies.
The economic cycle also has a significant impact on the relevance of EPS:
-
Cyclical companies can post spectacular EPS figures when they are at the peak of their cycle, but... that's when they are the riskiest to buy.
-
Conversely, these same companies can report very poor, or even negative, EPS figures during cycle troughs, when those could be great opportunities.
It's important to understand a company's position in its cycle to avoid being misled by EPS figures.
How to Use EPS Figures Properly🔗
Start by looking at the EPS trend over several years rather than a single period. Look for a consistent growth trend that indicates a sustainable competitive advantage rather than temporary fluctuations.
Dig deeper into earnings quality by comparing EPS to cash flow metrics. EPS consistently exceeding operating cash flow may be due to aggressive accounting or business practices that won't last. Conversely, companies that generate cash flow well above their reported EPS may be conservatively managed, with hidden value.
Context remains essential when interpreting EPS figures. Compare a company's EPS growth to that of its competitors in the same industry, and to its own historical trend. A company whose EPS growth is 5% per year may not seem great in isolation, but it could be exceptional for its industry. And spectacular EPS growth isn't ideal if it's due to cost reductions rather than revenue growth.
Check the source of EPS changes. Growth due to increased sales and margins is very healthy, but growth due to accounting changes is pointless.
Other indicators related to EPS🔗
To properly analyze your future investment, you need to supplement this with other criteria. The price-to-earnings ratio compares EPS to the share price, which allows you to assess valuation. But price-to-earnings ratios don't mean much if you don't take growth rates into account. This is where an indicator like the price-earnings-to-growth (PEG) ratio comes in, evaluating stocks based on their growth prospects.
Cash flow indicators are often more reliable than EPS. Free cash flow per share shows the cash generated by the company after it has made its investments, which provides a better view of the money actually available to shareholders. The relationship between EPS and free cash flow per share can show whether accounting profits translate into real economic value.
Return on equity (ROE) measures how efficiently a company generates profits from shareholders' equity. It's a good complement to per-share metrics, which focus on profitability relative to invested capital. A high EPS ratio isn't particularly meaningful if it requires significant investment. Return on invested capital (ROIC) gives profitability relative to all invested capital, which shows the company's true performance.
Book value per share is also interesting; it is the book value of assets less liabilities for each share. Comparing EPS to book value per share helps us see how efficiently a company uses its assets. Growth in book value per share over time indicates that the company is retaining and reinvesting its profits effectively.
The presence of dividends must be taken into account when analyzing EPS. The payout ratio (dividends per share divided by EPS) is the portion of profits a company redistributes to shareholders compared to the portion it reinvests in the company. This allows us to assess the sustainability of dividends and management's priorities for capital allocation.
Some examples🔗
To illustrate this, let's consider two companies with very different EPS:
Company A🔗
This mature consumer goods manufacturer has consistently grown its EPS by 5 to 7% per year over the past ten years. Its EPS closely tracks its free cash flow and maintains a consistent dividend payout ratio of 50%. For this company, EPS provides good information about its performance and valuation.
Company B🔗
This fast-growing software company has a highly volatile, sometimes negative, EPS due to massive investments in product development. However, its revenue is growing by 30% per year and its gross margins are steadily increasing. For this company, focusing on EPS could overlook the enormous value creation that is currently occurring.
During the 2008 crisis, many bank stocks looked cheap based on their historical EPS. But investors who delved into asset quality and the importance of shareholders' equity were able to see that past earnings bore little relation to future prospects. Conversely, companies like Microsoft posted rather modest EPS growth in the early 2010s, but generated enormous free cash flow. This was a sign of undervaluation, which could be masked by EPS.
Integrate EPS into the rest of the process🔗
Start with the business model and competitive position: Understanding how a company generates profits and defends its market position is more important than any single indicator. EPS trends can confirm or refute your analysis, but should not replace it.
For valuation, it's better to use asset valuation and discounted cash flow analysis. EPS is just one element among others.
Risk assessment remains essential, regardless of EPS. A company with strong EPS growth may face technological disruption or regulation that current earnings don't reflect.
In conclusion, like many indicators, EPS alone is not enough to make an investment decision. EPS analysis must be complemented with cash flow indicators, a competitive analysis, and an evaluation of the company's business.
Thanks to the photographers, graphic designers, and brand owners:
- Pie chart: Public domain
- Amazon historical profits: Atlas, FactSet